Data Analytics Training in Hyderabad: Develop Practical Skills for a Data-Driven Career
Every organization produces data, but raw numbers do not automatically provide useful answers. Businesses need professionals who can examine that information, identify patterns, create meaningful reports, and communicate what the numbers actually indicate.
This is why data analytics has become an important skill area for students, graduates, and working professionals. Learning tools such as Excel, SQL, Python, Power BI, and statistics can help build a foundation for working with business data.
The most useful training is not about memorizing commands. It is about learning how to apply those tools to practical problems.
Understanding Data Analytics
Data analytics is the process of examining information to discover patterns, trends, relationships, and useful insights.
A typical analytics workflow may involve:
-
Understanding a business requirement
-
Gathering relevant information
-
Cleaning and organizing datasets
-
Exploring the data
-
Performing calculations and analysis
-
Creating visualizations
-
Preparing dashboards or reports
-
Communicating the findings
For example, an online store may want to know why sales dropped during a particular month. An analyst could examine product categories, customer behavior, locations, order values, and previous sales trends to identify possible factors.
This shows why analytical thinking is just as important as technical knowledge.
Data Analytics Course in Hyderabad
A Data Analytics Course in Hyderabad can provide a structured learning path for people who want to enter the field.
Instead of learning every technology at once, beginners can progress gradually:
Excel → SQL → Statistics → Python → Data Visualization → Power BI → Projects
This sequence allows learners to build one skill on top of another.
Excel introduces spreadsheet-based analysis. SQL helps with database information. Python can be used for data preparation and analysis, while Power BI provides tools for creating interactive reports and dashboards.
Data Analytics Training in Hyderabad
When comparing Data Analytics Training in Hyderabad, look beyond the number of technologies mentioned in the advertisement.
A useful program should give learners opportunities to practice:
-
Data cleaning
-
Excel analysis
-
SQL queries
-
Python-based analysis
-
Statistical concepts
-
Data visualization
-
Dashboard creation
-
Business case studies
-
Practical projects
The important question is not simply, “How many tools are included?”
A better question is:
“Will I be able to use these tools to solve a data problem independently?”
That is where practical training becomes valuable.
Data Analytics Course in Hyderabad Offline
A Data Analytics Course in Hyderabad Offline can be a suitable choice for people who prefer learning in a classroom environment.
Classroom training may provide:
-
Direct interaction with trainers
-
Immediate clarification of questions
-
Live demonstrations
-
Guided practical exercises
-
Classroom discussions
-
A regular learning schedule
-
Peer interaction
Before joining an offline course, attending a demo class can help you understand the teaching approach.
Also check whether students spend enough time practicing instead of only listening to lectures.
Data Analytics Certification in KPHB, Hyderabad
Students looking for Data Analytics Certification in KPHB, Hyderabad should consider both the training and the certification process.
Important questions include:
-
What topics are covered?
-
Which tools are taught?
-
Are practical assignments included?
-
Are projects part of the program?
-
How is the learner assessed?
-
What are the certification requirements?
-
Is project guidance available?
-
Is interview preparation offered?
A certificate can document completion of a program, but practical projects can provide stronger evidence of how well you can apply your knowledge.
Data Analytics Online Course in Hyderabad
An Data Analytics Online Course in Hyderabad can be useful for students and professionals who need a flexible learning arrangement.
However, online learning should still provide opportunities for active practice.
When comparing online programs, look for:
-
Live instructor sessions
-
Practical assignments
-
Dataset-based exercises
-
Doubt-clearing support
-
Project guidance
-
Assessments
-
Recorded resources where appropriate
-
Interview preparation
The flexibility of online education is useful, but consistent practice remains essential.
Data Analytics Certification Online
A Data Analytics Certification Online gives learners an option to complete structured training without attending a physical classroom.
Before selecting an online certification, understand how the certificate is awarded.
A meaningful learning program should encourage learners to complete practical work such as:
-
SQL exercises
-
Excel reports
-
Python analysis
-
Power BI dashboards
-
Data interpretation tasks
-
Capstone projects
This creates a learning record that goes beyond simply completing video lessons.
How to Evaluate Data Analytics Training Institutes in Hyderabad
There are many Data Analytics Training Institutes in Hyderabad, so comparing them carefully can prevent you from selecting a course based only on promotional language.
Consider these factors:
| Evaluation Area | What to Check |
|---|---|
| Course Content | Core analytics concepts and relevant tools |
| Practical Training | Regular hands-on exercises |
| Projects | Realistic business or industry datasets |
| Trainers | Technical knowledge and teaching experience |
| Class Format | Offline, online, or hybrid |
| Assessments | Assignments, tests, and practical evaluation |
| Support | Doubt clearing and project assistance |
| Portfolio | Opportunities to create demonstrable work |
| Career Support | Resume and interview preparation |
| Certification | Transparent assessment and completion process |
Terms such as “best” or “top” do not tell you enough about the actual learning experience. The syllabus, teaching method, practice, and project work are more useful points of comparison.
Essential Skills for a Data Analytics Learner
Excel
Excel is widely used for organizing information, performing calculations, filtering records, creating summaries, and preparing reports.
Learners can progress from basic formulas to pivot tables, lookup functions, data cleaning, and visualization.
SQL
SQL allows analysts to work with structured information stored in databases.
You can use SQL to:
-
Retrieve records
-
Filter information
-
Join tables
-
Group data
-
Calculate metrics
-
Identify trends
Python
Python adds programming capabilities to the analytics workflow.
It can be used for:
-
Data cleaning
-
Data transformation
-
Exploratory analysis
-
Automation
-
Statistical analysis
-
Working with larger datasets
Libraries such as Pandas and NumPy are commonly used for data-related tasks.
Power BI
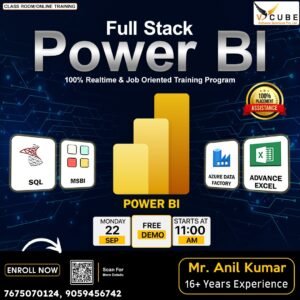
Power BI is useful for turning analyzed information into interactive dashboards and reports.
A well-designed dashboard can help users monitor KPIs, compare performance, identify changes, and explore data without reading large tables.
Statistics
Statistics helps learners understand what the numbers mean.
Concepts such as averages, distributions, probability, variation, correlation, and sampling provide a foundation for interpreting analytical results correctly.
Why Hands-On Projects Matter
Knowing individual tools does not automatically mean you can complete an end-to-end analytics assignment.
Projects bring the different skills together.
For example, imagine a retail company provides a year’s worth of sales data.
You could:
Import the data → Clean the records → Query information with SQL → Analyze patterns with Python → Create visualizations → Build a Power BI dashboard → Present business findings
This type of project gives learners experience with the complete workflow.
Practical Project Ideas
A training program can use projects based on scenarios such as:
-
Retail sales
-
E-commerce orders
-
Customer behavior
-
Marketing performance
-
Employee information
-
Inventory management
-
Financial reporting
-
Product performance
-
Business KPI monitoring
The objective is not just to create attractive charts. Learners should be able to explain the insight behind each visualization.
Building a Data Analytics Portfolio
A portfolio can help demonstrate your practical knowledge.
Instead of listing only:
Excel | SQL | Python | Power BI
you can show actual examples of your work.
For example:
Project: E-commerce Sales Analysis
Tools: SQL, Python, Power BI
Task: Analyze sales and customer purchasing patterns
Output: Interactive dashboard and analytical report
Finding: Identify important sales trends and business KPIs
This gives recruiters and interviewers something concrete to discuss.
Offline and Online Learning Options
The right format depends on your schedule and preferred learning environment.
Offline training may work well if you prefer:
-
Face-to-face teaching
-
Fixed class timings
-
Classroom interaction
-
Direct trainer assistance
Online training may work well if you need:
-
Flexible scheduling
-
Remote learning
-
Access from home
-
Compatibility with work or college
Neither format automatically guarantees better learning. The important factors are teaching quality, practical work, feedback, consistency, and project experience.
Data Analytics Training at V Cube Software Solutions
V Cube Software Solutions is a software training institute in Hyderabad offering technology-oriented learning programs.
If you are considering a data analytics program, review the current course curriculum, training format, practical sessions, trainer details, project structure, certification process, and career-support options before enrolling.
The objective of training should be to help learners develop skills that they can apply beyond the classroom.
Career Opportunities After Data Analytics Training
After building the required technical foundation and practical experience, learners can explore roles such as:
-
Data Analyst
-
Junior Data Analyst
-
Reporting Analyst
-
Business Analyst
-
BI Analyst
-
Data Visualization Analyst
Job requirements vary between companies. Your educational background, technical abilities, project portfolio, communication skills, and experience can all influence the opportunities available to you.
A Practical Learning Roadmap
If you are starting your analytics journey, keep the learning process manageable.
Step 1: Understand data fundamentals
Learn how datasets are structured and how businesses use data.
Step 2: Build Excel skills
Practice formulas, pivot tables, filtering, cleaning, and reporting.
Step 3: Learn SQL
Work with databases and practice writing queries.
Step 4: Study statistics
Understand the concepts required to interpret data.
Step 5: Learn Python
Use Python for cleaning, transforming, and analyzing datasets.
Step 6: Learn visualization
Understand how to select appropriate charts for different types of information.
Step 7: Practice Power BI
Build dashboards using realistic datasets.
Step 8: Complete projects
Combine several tools to solve end-to-end problems.
Step 9: Build your portfolio
Document your projects, dashboards, findings, and analytical process.
Step 10: Prepare for interviews
Practice explaining your technical decisions and project results clearly.
Final Thoughts
A career in data analytics starts with more than collecting certificates. It requires an understanding of data, familiarity with relevant tools, practical experience, and the ability to communicate insights.
Whether you are researching Data Analytics Training Institutes in Hyderabad, a Data Analytics Course in Hyderabad Offline, Data Analytics Certification in KPHB, Hyderabad, an Online Data Analytics Course in Hyderabad, or Data Analytics Certification Online, compare the actual curriculum and learning experience carefully.
A practical approach is:
Learn the fundamentals → Practice with datasets → Develop tool-based skills → Build projects → Create a portfolio → Prepare for interviews. 📊
That keeps the focus where it belongs: real skills, useful projects, and the ability to turn data into meaningful information.